‘When will it be done?’
If you have worked with stakeholders or clients, you will have come across this before. The knee-jerk response is ‘it depends’.
Sometimes you look at the team’s velocity to work this out. A common formula to use is below:
Duration = Story Points of Estimated Item/Team’s Velocity X Sprint Length
This formula assumes that you have a steady velocity. It does not take into account random events or uncertainty.
When you miss your deadline, this frustrates clients and stakeholders.
I wanted to know if there’s another way to think about this. I picked up ‘When will it be done?’ by Daniel S. Vacanti after having a recommendation from my colleague, an all-round delivery superstar, Áine McKay. The book dives into something called probabilistic forecasting.
Probabilistic forecasting is an alternative to an estimates based approach. Rather than asking your teams to break down a lot of work up front, and then estimate it, we can use past data generated by the team from the work they’ve already done to extrapolate a forecast of what may happen in the future. Source.
Forecasting for a single item
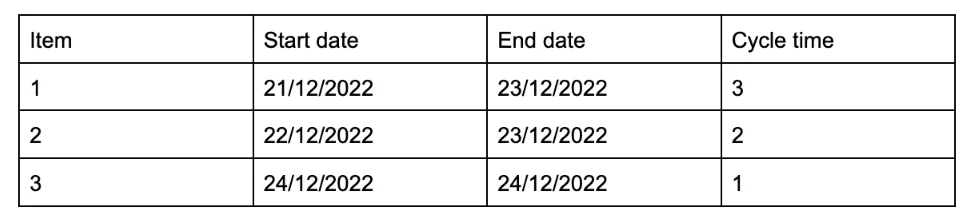
To work this out, you need to know when you’ve started a piece of work, and when it ends. We will use this to work out the cycle time (the amount of time it takes for work to complete).
Cycle time = End time - Start time + 1
We add the +1 because we want to capture every day the item is worked on.
Now, we want to plot this data into something called a Cycle Time Scatterplot. It will look something like this:
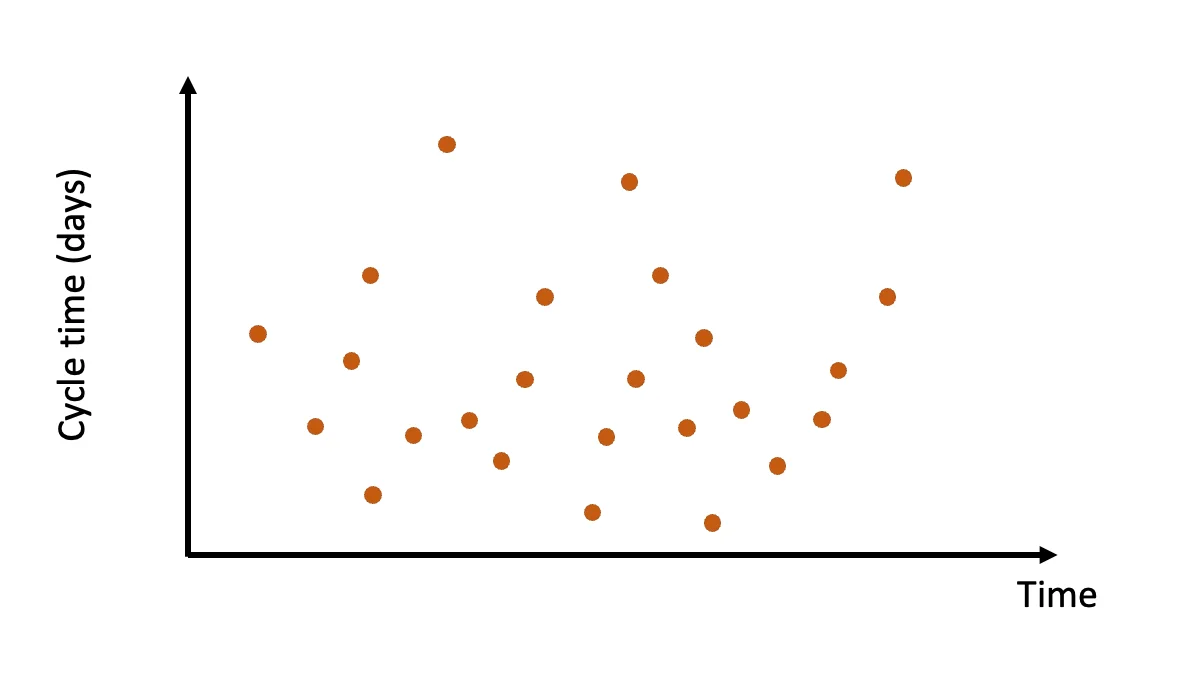 Cycle Time Scatterplot by PaceMkr: https://www.pacemkr.ca/the-cycle-time-scatter-plot-chart/
To make sense of all these points, we want to understand how many items fall below a certain percentage. To do this, we use percentile lines.
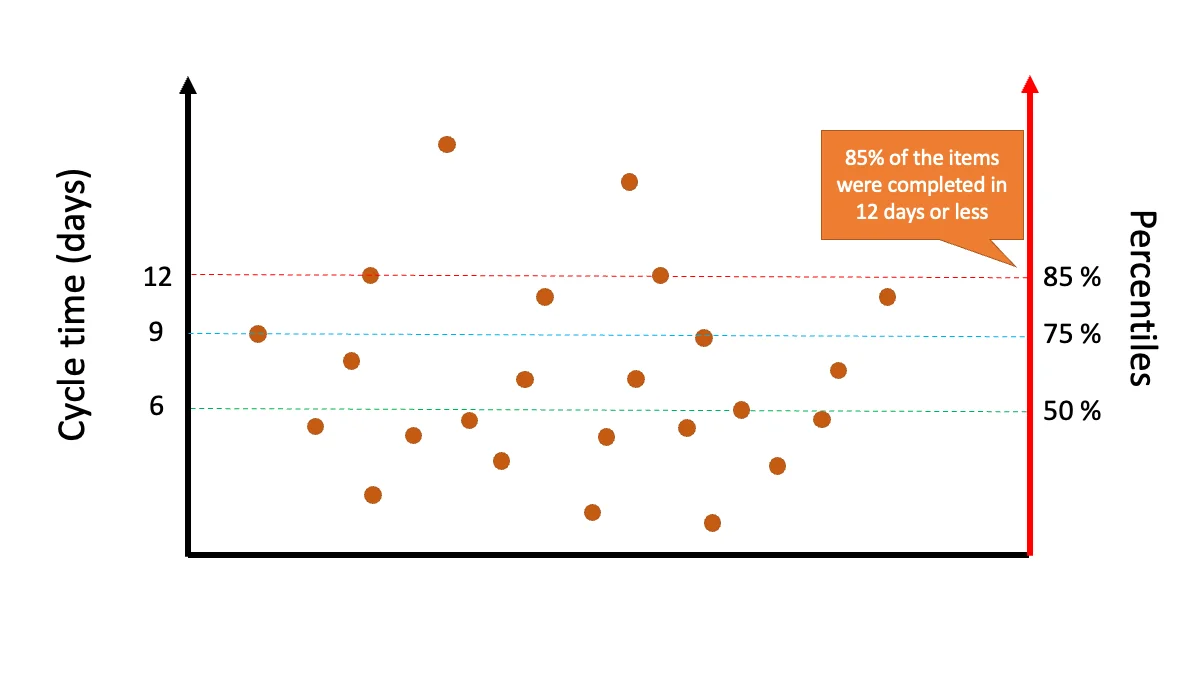 Cycle Time Scatterplot with percentile lines by PaceMkr: https://www.pacemkr.ca/the-cycle-time-scatter-plot-chart/
If a stakeholder asks, ‘how long will it take to complete this item?’, you can say ‘this chart tells us that 85% of items are completed in 12 days or less.’
If you want to use an example template, please see Throughput Forecaster: I want to forecast how long a single feature may take.
Forecasting for many items
In Daniel’s book, he talks about rolling a two, six-sided dice. There are many possible outcomes of what you could role. What if I wanted to know the probability of rolling a three and a four? We can use the Monte Carlo simulation to work this out. In essence, we are inputting data and performing many random samples to come out with probability-based results.
Generally, Monte Carlo simulations follow a certain pattern. Let’s take our dice example:
- Define our inputs e.g. the sum of the numbers of the two, six-sided dice
- We roll our dice and track the results.
- We repeat the rolling of our dice many times and aggregate the result into a histogram. We could roll our dice 1000 times as an example.
- Now we can calculate the probabilities of certain outcomes.
The value of the Monte Carlo simulation is that it takes into account uncertainty. In the dice example, throwing it 1000 times takes into account random events (and thus uncertainty). Monte Carlo can help you work out when many items will likely be completed, and how many tasks can be completed in a given time.
Let’s look at an example, from nave. In the Monte Carlo simulation, a client asks you when 10 items will be done.
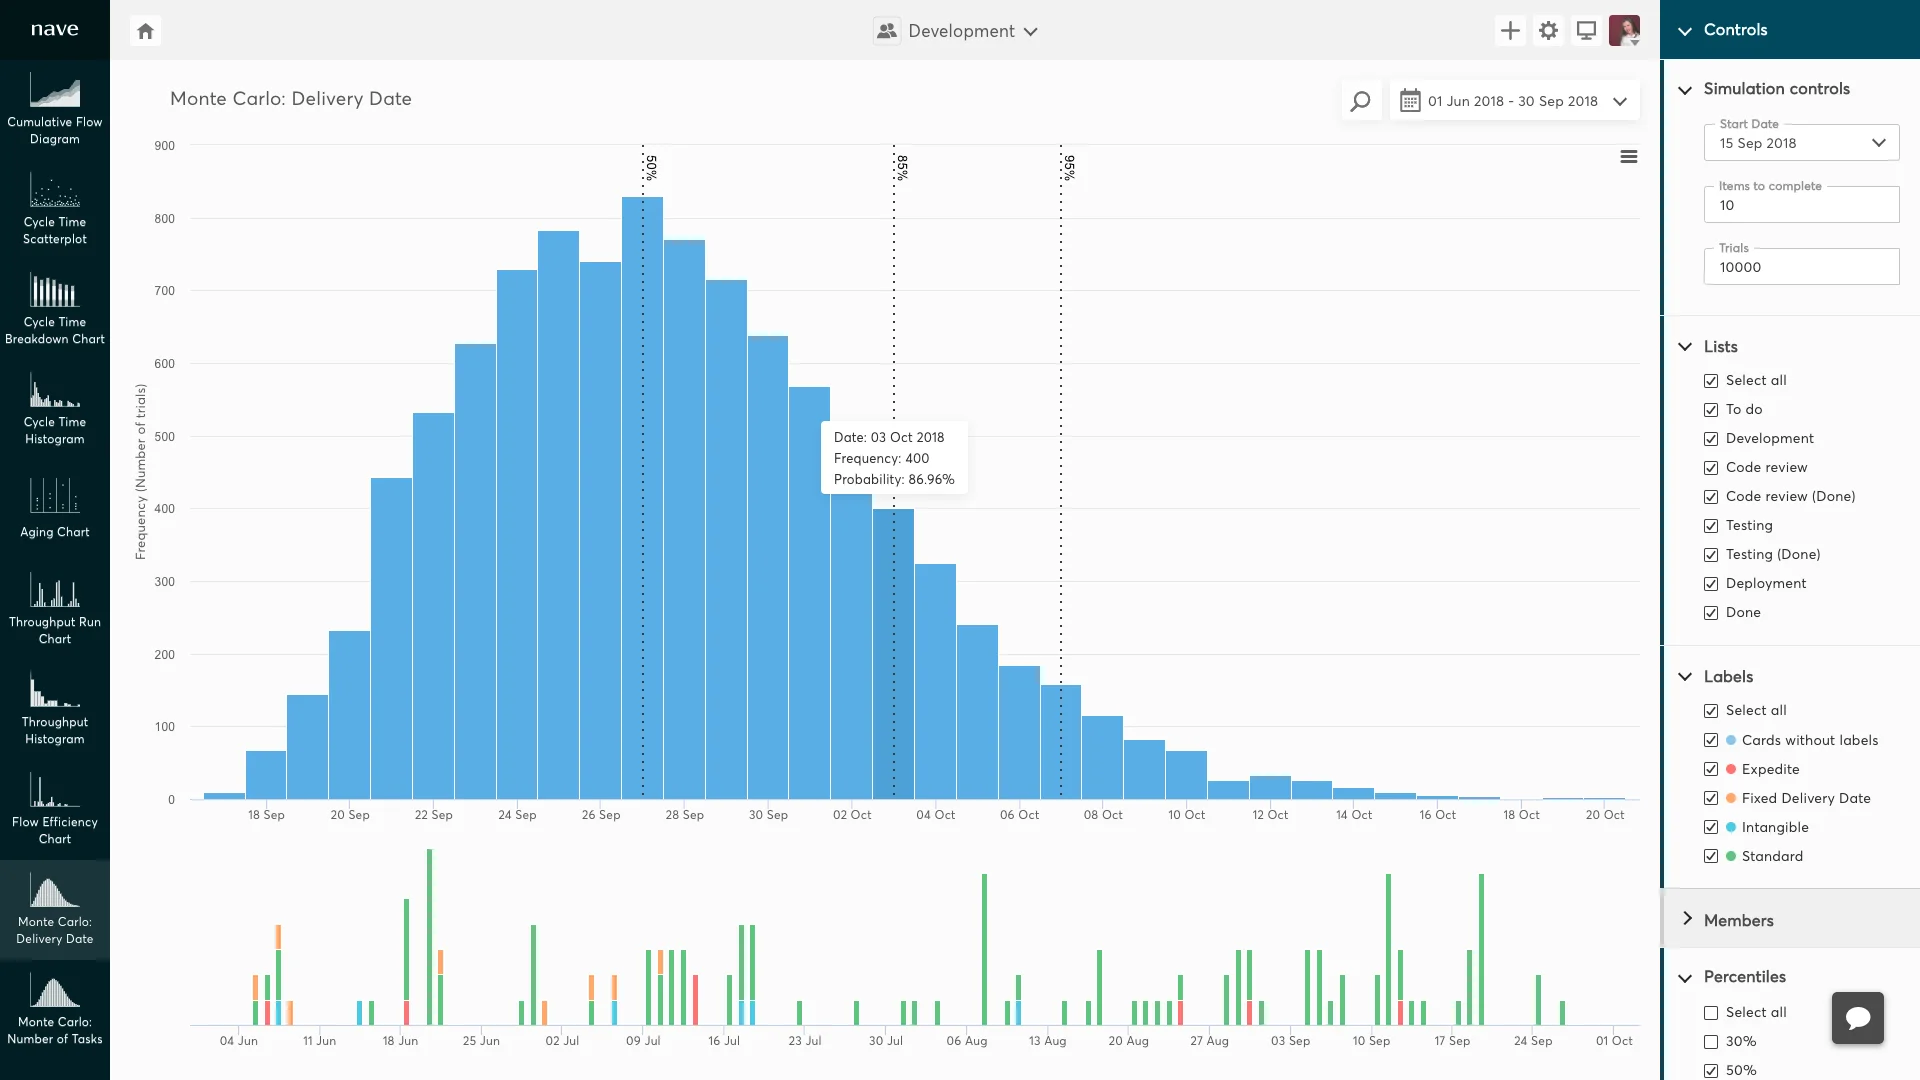 Monte Carlo simulation. The x axis shows dates: https://getnave.com/blog/monte-carlo-simulation/
Monte Carlo simulation can help you work out the likelihood of delivering to this target. Using Monte Carlo, you can say ‘I have 85% confidence that the items will be delivered by 3rd October 2018’.
If you want to work out your level of confidence in delivery of X tasks by a certain date, you can use a Monte Carlo simulation. Please note, that the graph will change so the x axis will now show ‘Number of Tasks’.
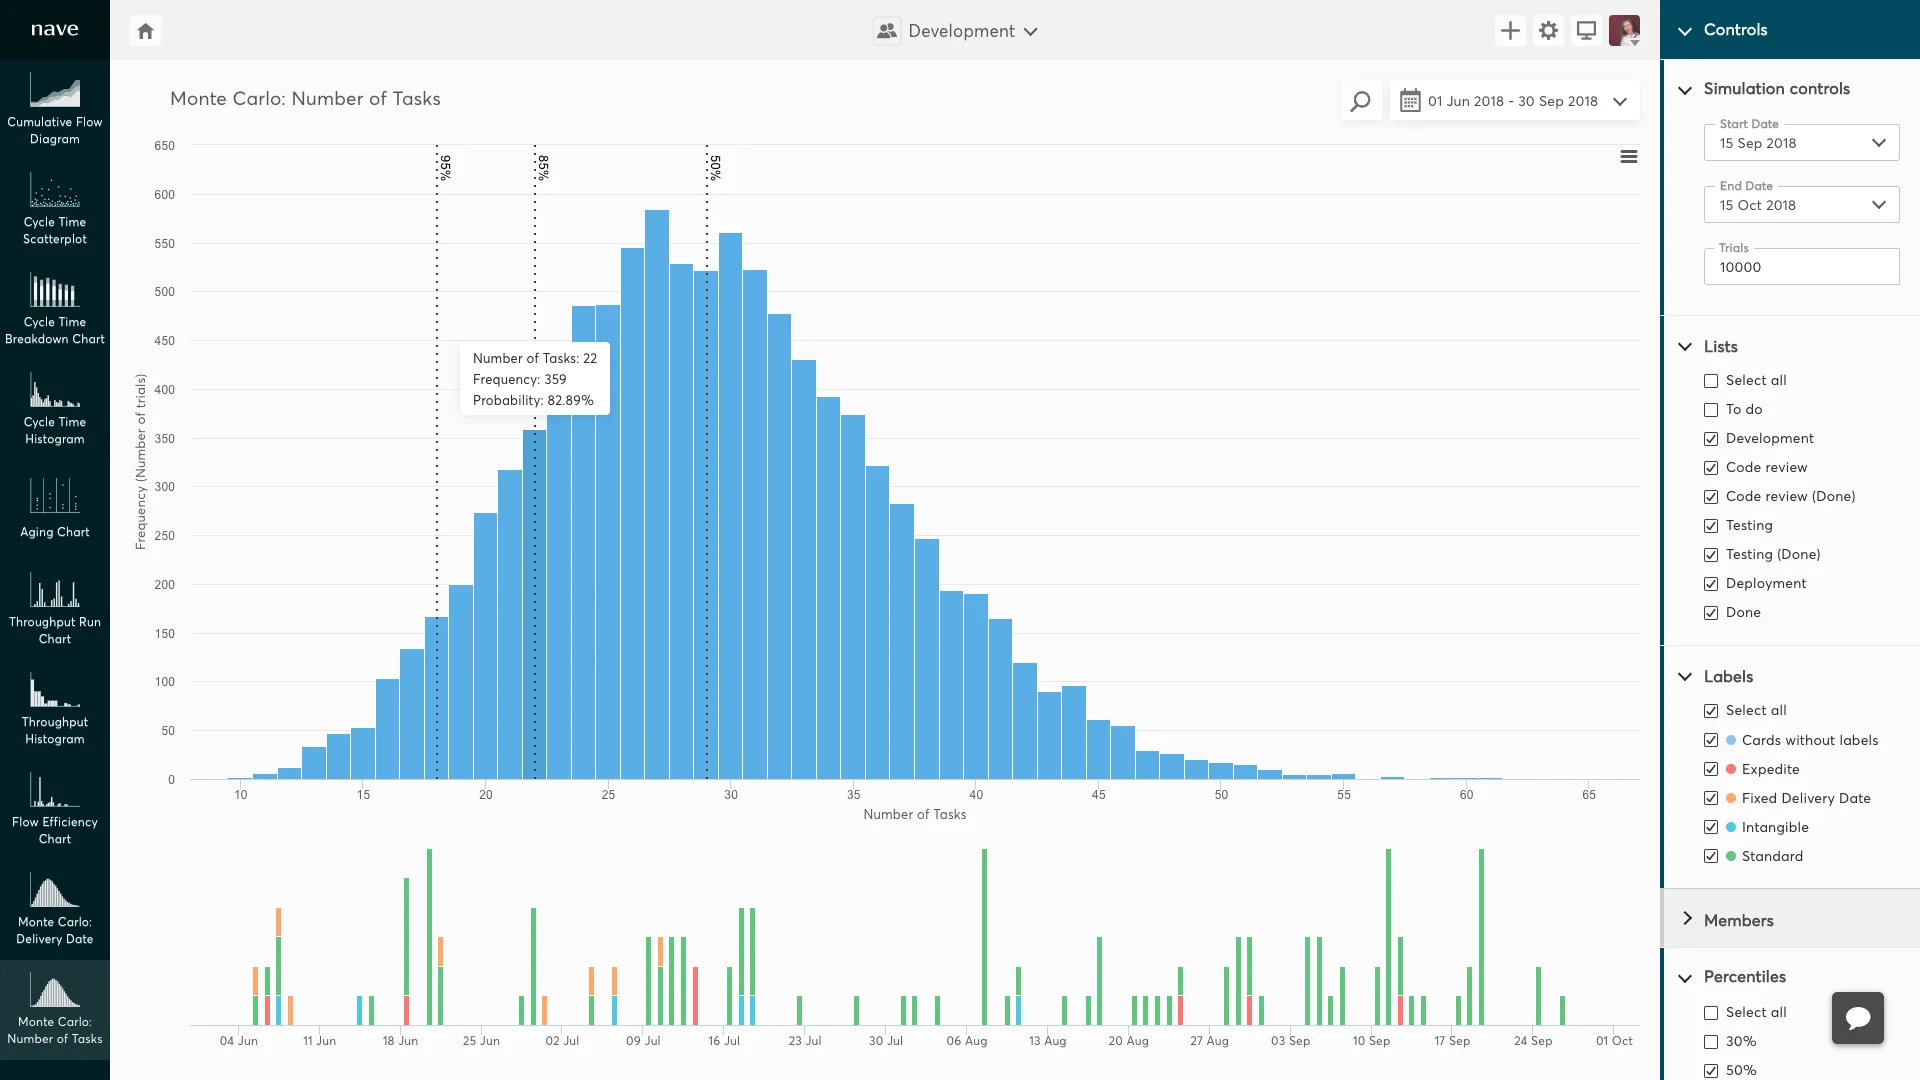 Monte Carlo simulation. The x axis shows number of tasks: https://getnave.com/blog/monte-carlo-simulation/
So if a client asks, what is the level of confidence in delivering 22 tasks by the 17th September 2018? Using Monte Carlo, you can say ‘I have 82% confidence that 22 items will be delivered by 17th September 2018’.
I won’t replicate how to create a Monte Carlo simulation here. This blog post does a better job than I could.
If you want to use an example template, please see Multiple Feature Cut Line Forecaster: I want to forecast multiple features at once.
Reflections
- The future looks like the past data you put in. If you don’t have data, then you’ll need to collect it. Initially collecting this data can be hard and time consuming.
- The data you use is important. For example, using large quantities of data will not necessarily give you an accurate forecast. Daniel’s book talks a lot about re-forecasting when you get new information. This means using data from three months ago rather than data from two years ago.
- The book also talks about getting into a stable flow of delivery. If you are in flux and things are changing all the time, the data you are collecting won’t be helpful in producing accurate forecasts. You don’t need to collect lots of data to start with. Try starting with data from 10-20 tickets.
- Probabilistic forecasting doesn’t need uniformity in ticket sizes. You want to keep the system moving. Try and get these tickets into a manageable form.
- I don’t see forecasting as the responsibility of a Product Manager (though they should be able to understand what it is showing them). A Delivery Manager should own this as this helps them to improve processes within a team.
- In government projects, we tend to have fixed time boundaries, and varying teams. It means it is hard to collect data over a prolonged period of time. Probabilistic estimation is more valuable in Beta, Live and Support work, when it is about delivering software on a regular basis.
- Shifting away from classic planning poker sessions towards probabilistic estimation will need a big culture change in many teams. Speaking to Áine, she suggests easing the transition to probabilistic estimation by making comparisons between what you estimate in planning poker vs. what Monte Carlo simulation comes up with.
- A traditional sprint planning meeting changes into more of a discussion around the ticket to make sure the team understands the user story and acceptance criteria. The long term goal would be to shift away from planning poker.
- One issue I’ve run into is tickets staying in the ‘blocked’ section for a long time. In government this may be due to data sharing agreements needing to be signed. We progress the ticket so that once the agreement is signed we can move fast. The book suggests limiting ‘work in progress’. Sometimes a ticket like this will impact your flow metrics. You may want to consider removing outliers from your forecasting if you feel like it is not representative of your sample.
- The book talks about having active and inactive states on your KANBAN board. This would be useful if you want to calculate flow metrics e.g. the rate at which a ticket flows through your process. This blog post gives an example of what your KANBAN board could look like.
I am by no means an authoritative figure on this subject. I’m someone who wants to start a conversation around how to provide better estimates for work. I recommend reading Daniel’s book. This blog post is a surface level view into a complex space. For that reason, please get in touch if you’ve implemented probabilistic forecasting in your workplace. I’d love to learn about your experience.
Finally, a huge thank you to Áine McKay who took the time to explain this to me and answer my many questions!